Global Daily Altimeter Sea Surface Height (DASH1.0)
2 NOAA/NESDIS, College Park, MD
3 Joint Center for Satellite Data Assimilation, Boulder, CO
Sea level is an essential environmental variable that impacts many aspects of weather and climate. The associated software package is used to construct the 32-year (1993-2024) daily global 1/4°x1/4° DASH1.0 (DASH1 for short) analysis of sea level anomaly based on more than 1 million altimeter tracks of 1Hz Level-2 altimeter sea level measurements obtained from the Radar Altimeter Database System. DASH1 accuracy is evaluated four ways: by examination of the results of observing system experiments, examination of analysis increments,
DASH1.0 Data Repository
Access gridded daily sea level anomaly, analysis increments, dynamic topography, and observing system experiment datasets.
Key Highlights
32-Year Continuous Record
Continuous daily record spanning 1993 through 2024 on a global 1/4° × 1/4° grid derived from over 1 million satellite tracks.
Open Source & JEDI-Based
Built on the JCSDA Joint Effort for Data Assimilation Integration (JEDI) variational software with scale-dependent, geographically varying error statistics.
Automated Quality Control
Incorporates automatic detection of erroneous satellite tracks (rejecting 3–7% of bad tracks) and ensemble-based error estimation.
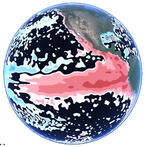
Sample Analysis
Data Specification & Access
The DASH1.0 dataset and analysis fields are publicly accessible via HTTP server hosted by the Department of Atmospheric and Oceanic Science at UMD.
wget -r -l1 --no-parent --progress=bar -nd -A 'dash1_1993_2024.tar.gz' https://dsrs.atmos.umd.edu/DATA/DASH1
| Parameter | Specification |
|---|---|
| Spatial Resolution | Global 1/4° × 1/4° grid (0.25° × 0.25°) |
| Temporal Resolution | Daily averages (1993–2024, 11,688 days) |
| Primary Variables | Daily Sea Level Anomaly (SLA), Analysis Increments (SW & LW), Dynamic Topography |
| Input Source | Level-2P 1Hz nadir along-track altimeter data from Radar Altimeter Database System (RADS) |
| Data Access Link | http://dsrs.atmos.umd.edu/DATA/DASH1/ |
System & Mapping Methodology
DASHv1 models sea level anomaly observations as a combination of long-wavelength and shorter-wavelength eddy signals:
- Polynomial Filtering: Each 1Hz along-track observation is separated into a 6th-degree polynomial along-track distance (long-wave component) and short-wave residual.
- Variational Mapping: Long and short wavelength components are mapped separately using JEDI 3DVar minimizing quadratic cost functions.
- Background Forecast Model: Background estimates are generated using a latitudinally varying zonal eddy advection model.
- Sea Ice Masking: Gridded outputs are masked daily where passive microwave sea ice concentrations exceed 15% (using NOAA/NSIDC CDR v5).
Input Altimeter Missions (15 Satellites)
DASH1.0 integrates 1,158,033 satellite tracks collected across 15 altimeter missions between 1993 and 2024:
| Sensor | Start Year | End Year | Inclination (°) | Total Days |
|---|---|---|---|---|
| ERS1 | 1993 | 1996 | 98.6 | 1229 |
| ERS2 | 1995 | 2011 | 98.6 | 5623 |
| TOPEX | 1993 | 2005 | 66.0 | 4309 |
| POSEIDON | 1993 | 2002 | 66.0 | 333 |
| GFO | 2000 | 2007 | 108.0 | 2481 |
| JASON 1 | 2002 | 2013 | 66.0 | 4002 |
| ENVISAT | 2002 | 2012 | 98.6 | 3495 |
| JASON 2 | 2008 | 2019 | 66.0 | 3861 |
| CRYOSAT 2 | 2010 | 2024 | 92.0 | 4855 |
| SARAL/AltiKa | 2013 | 2024 | 98.5 | 3934 |
| JASON 3 | 2016 | 2024 | 66.0 | 2817 |
| Sentinel 3A | 2016 | 2024 | 98.7 | 2796 |
| Sentinel 3B | 2018 | 2024 | 98.7 | 2064 |
| Sentinel 6 | 2020 | 2024 | 66.0 | 1110 |
| SWOT NADIR | 2023 | 2024 | 77.6 | 174 |
Validation & Quality Evaluation
DASH1.0 accuracy has been rigorously evaluated using four complementary methods:
- Observing System Experiments: Ensemble experiments with added Gaussian random noise demonstrate observation errors under 0.005 m near the equator.
- Analysis Increments: Increment statistics confirm negligible time-mean bias (< 10-4 m) and zero spurious trend.
- Tide Gauge Comparison: Comparison to 20 independent island tide gauges yields high correlation (average r = 0.85, up to >0.96 in tropical Pacific).
- Intercomparison: Statistical comparisons against NOAA Coastwatch (r > 0.85) and DUACS DT2021/DT2024 (r > 0.9) confirm high baseline consistency.
Citation & Contact
When using DASH1.0 data in publications or presentations, please cite the primary reference:
Corresponding Author: James A. Carton (carton@umd.edu)