SODA3/4 Global Ocean Heat Content
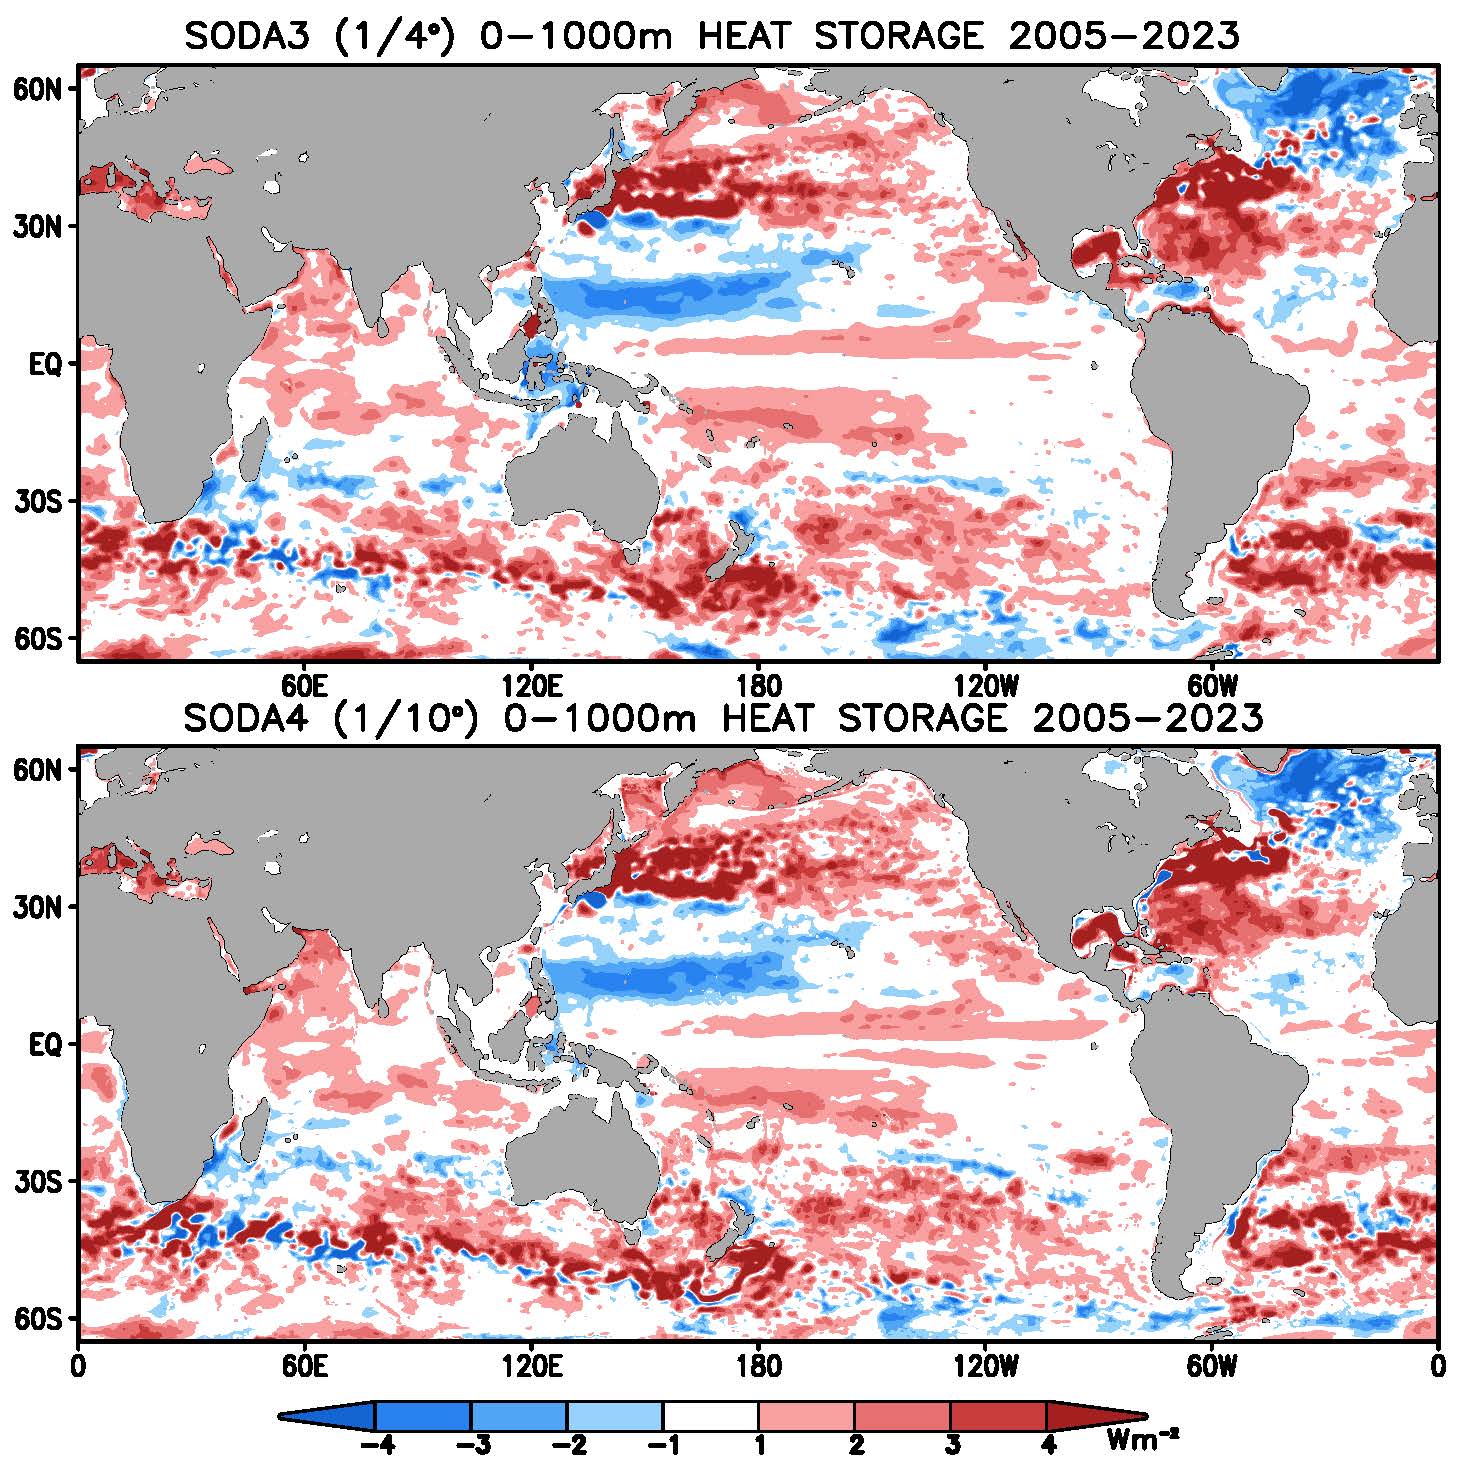
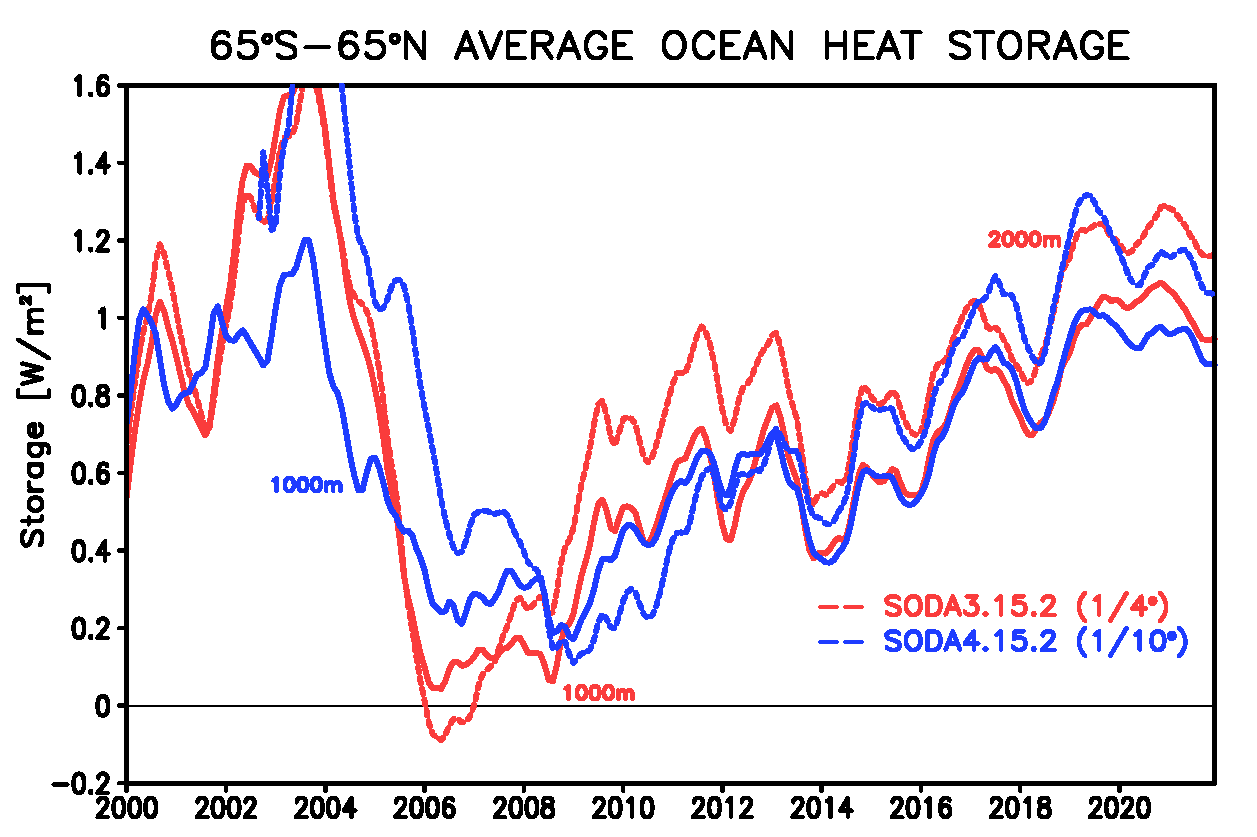
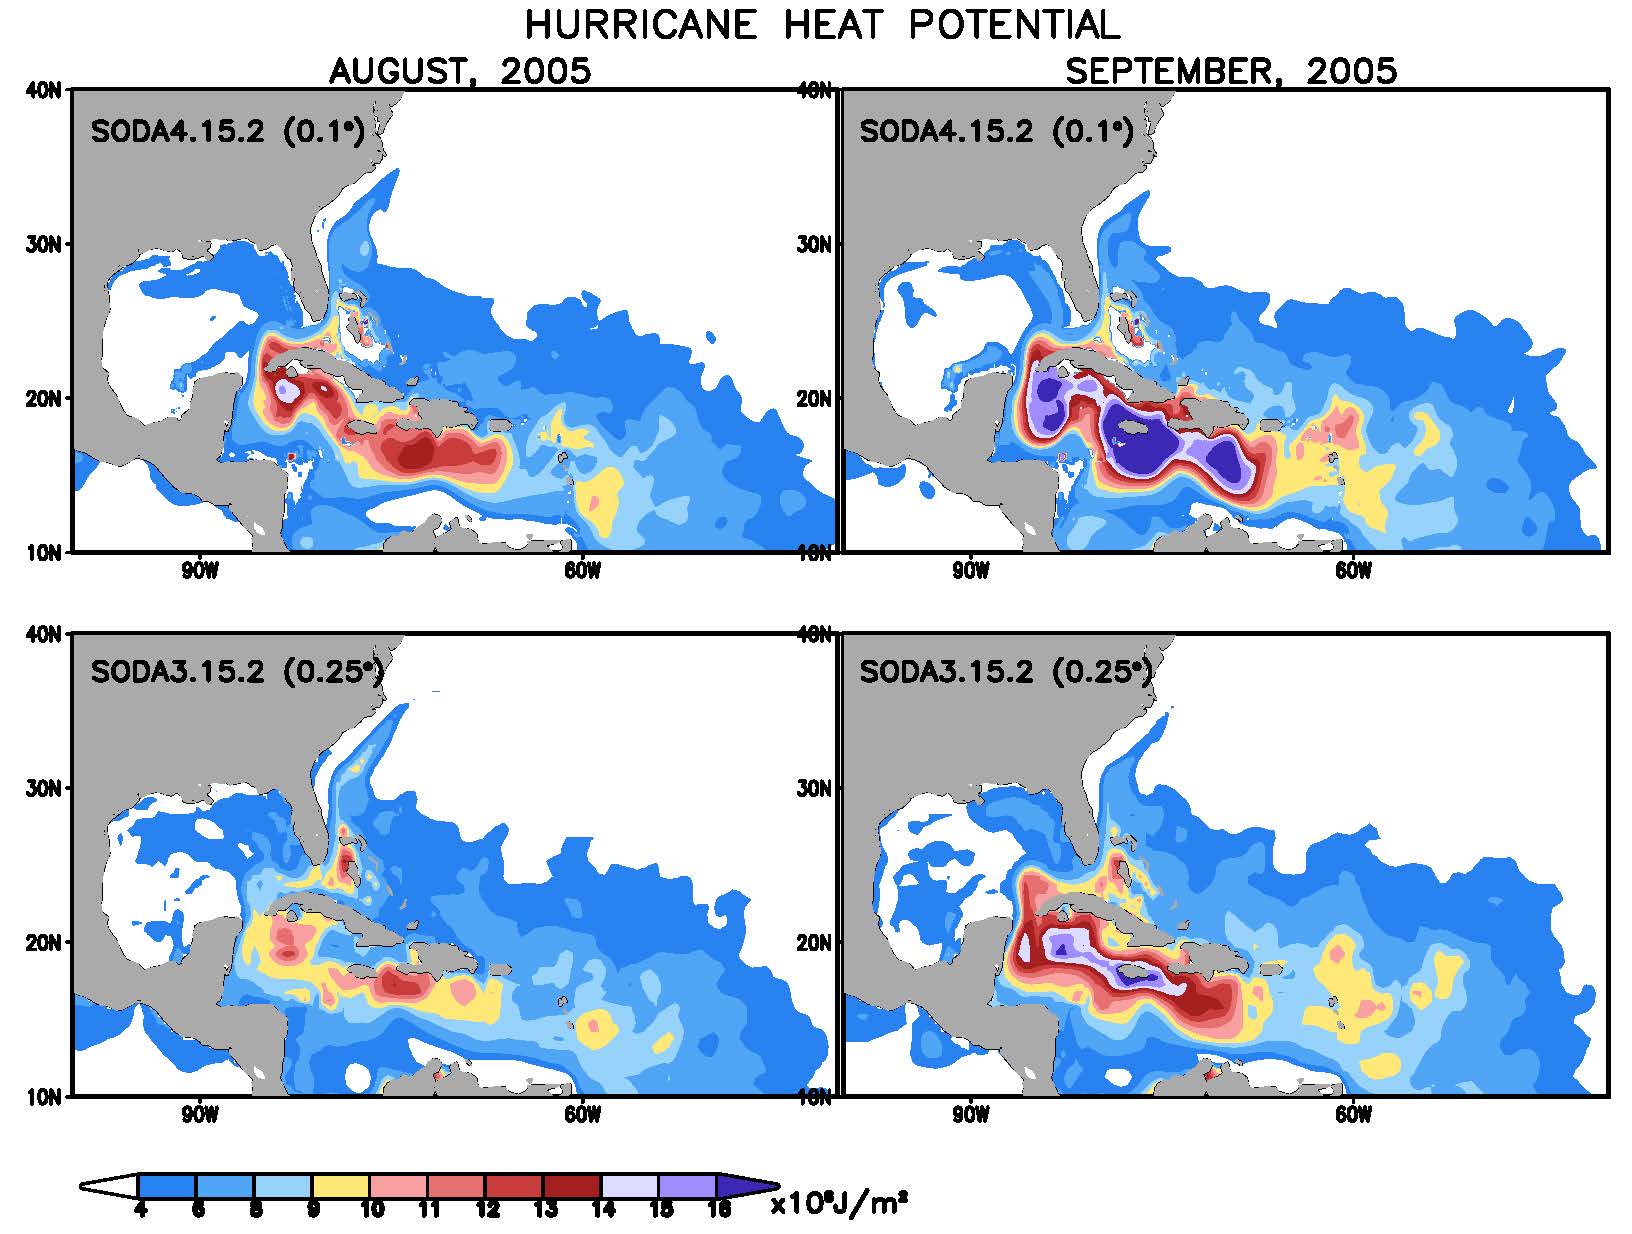
Half of the sunlight that enters top of the atmosphere (341 W/m2) is absorbed at the surface of our planet. This surface energy flux is 1) stored locally, 2) advected horizontally, or 3) returned to the atmosphere. Here we present monthly ocean heat content during the 43 year period 1981-2023 based on eddy-permitting and eddy-resolving versions of the SODA ocean/sea ice reanalysis driven by meteorological forcing. Monthly anomalies of energy per unit horizontal area (J/m2) are presented relative to their 19-year average (2005-2023) over two fixed depth intervals 0-1000m and 0-2000m, and shallower than the depth of the 26C isotherm (tropical cyclone heat potential).
Heat Content Data Repository
Access SODA3/4 gridded monthly heat content and gridded monthly tropical cyclone heat potential datasets. The former are available both as annual files and as single files, concatenated and gunzipped.
Key Highlights
43-Year Continuous Record
Continuous monthly record spanning 1981 through 2023 .
Two analyses
Here you can compare SODA3 (1/4° × 1/4°) and SODA4 (1/10° × 1/10°) results
Two depths
For each analysis monthly heat content anomaly is available for both 0-1000m and 0-2000m depth ranges as well as tropical cyclone heat potential.
Sample Analysis 1
Sample Analysis 2
Sample Analysis 3
Data Specification & Access
The SODA3/4 heat content analysis fields are publicly accessible via HTTP server hosted by the Department of Atmospheric and Oceanic Science at UMD.
wget -r -l1 --no-parent --progress=bar -nd -A 'soda4.15.2_heat2000_mn_2005-2023.tar.gz' https://dsrs.atmos.umd.edu/DATA/DASH1/heat_content
| Parameter | Specification |
|---|---|
| Spatial Resolutions | Global 1/4° × 1/4° grid (0.25° × 0.25°) or 1/10° × 1/10° grid (0.1° × 0.1°) |
| Temporal Resolution | Monthly (1981-2023, or 2005-2023) |
| Primary Variable | Heat content anomaly relative to 2005-2025 (HC J/m2) |
| Input Source | A key input data set is the World Ocean Database of hydrographic profiles |
| Data Access Link | http://dsrs.atmos.umd.edu/DATA/DASH1/heat_content |
System & Mapping Methodology
SODA3/4 use sequential data assimilation to constrain a nonlinear model of the primitive equations forced by specified ERA5 surface meteorology
Validation & Quality Evaluation
SODA3/4 accuracy has been rigorously evaluated using four complementary methods:
- Independent Observations: Comparisons have been made to data sets such as sea level that have not been assimilated
- Analysis Increments: Increment statistics confirm negligible time-mean bias and no evidence of spurious trend.
- Intercomparison: Statistical comparisons between SODA3 and SODA4 and comparisons to reanalyses from other centers have been published.
Citation & Contact
When using DASH1.0 data in publications or presentations, please cite the primary reference:
Corresponding Author: James A. Carton (carton@umd.edu)